
How can we help you?
Section 20: Dashboard
Tchoum Growth
Section 20: Dashboard
① Introduction to the Dashboard
The Tchoum Growth Dashboard is a centralized interface that consolidates key metrics and essential tools for your business, providing an overview of your performance and activities.
② Accessing the Dashboard
After logging into your Tchoum Growth account, the Dashboard is usually the first page displayed.
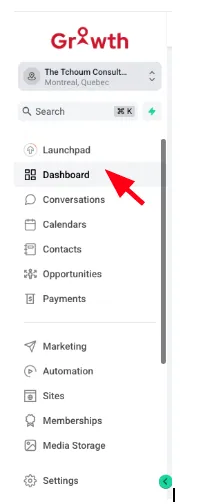
Here is what the "Dashboard" page looks like:
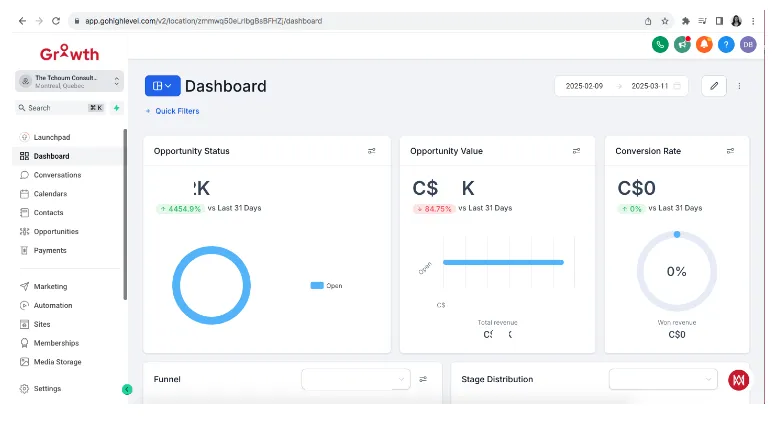
③ Dashboard Widgets
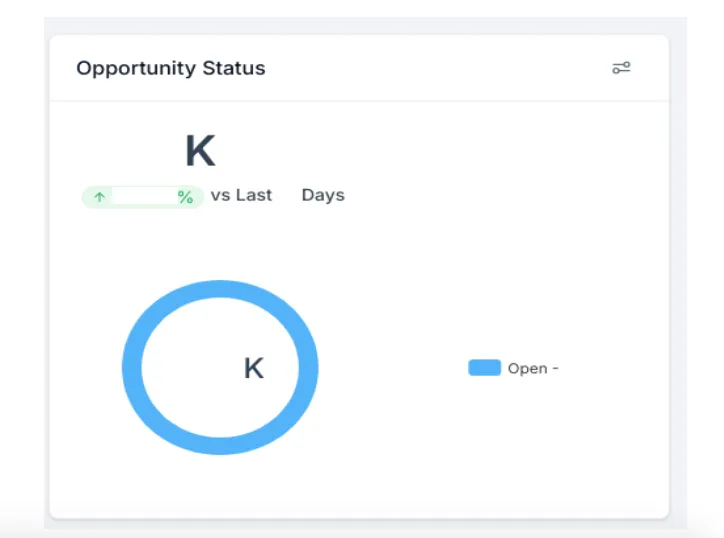
Opportunities: Displays the current opportunities in your sales pipeline.
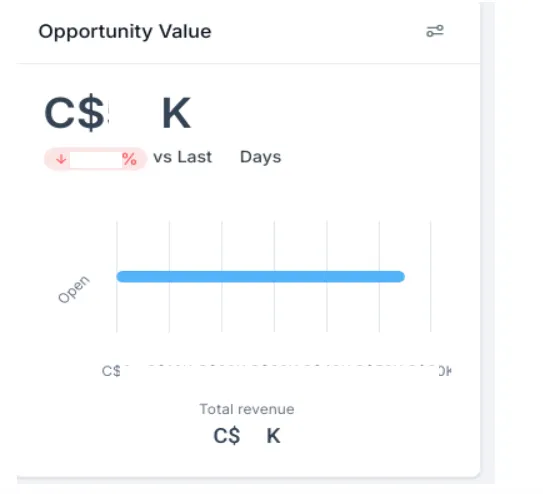
Pipeline Value: Shows the total value of opportunities in the pipeline.
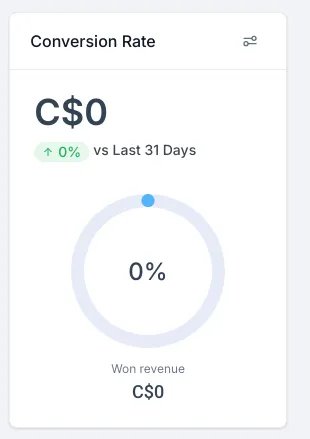
Conversion Rate: Indicates the percentage of opportunities converted into sales.
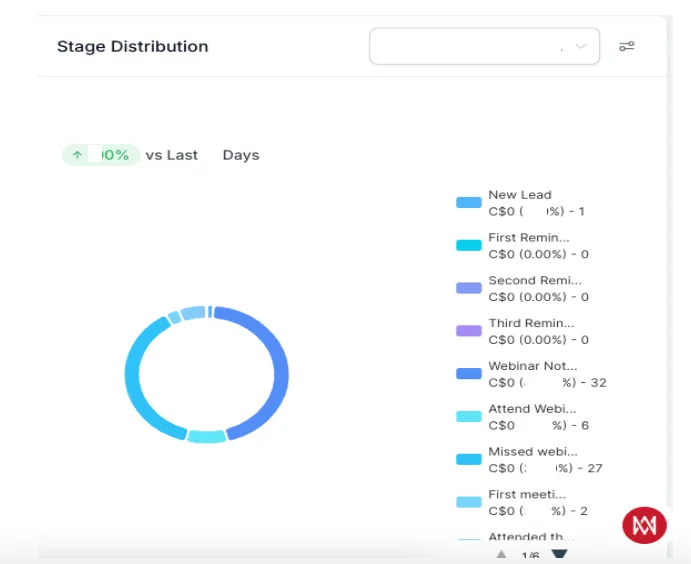
Stage Distribution: Visualizes the distribution of opportunities across the different stages of the pipeline.
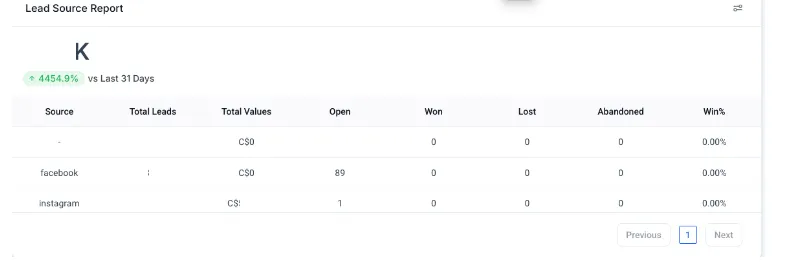
Lead Source Report: Explains the origin of your leads.
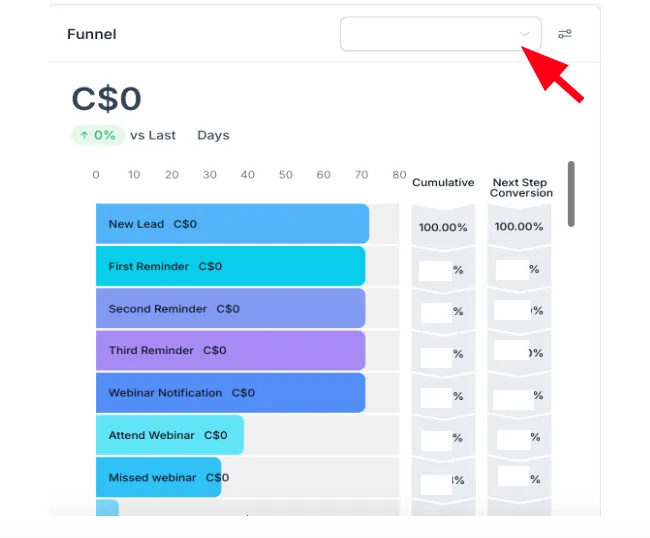
Funnel
Description: This widget provides a visualization of sales or marketing journeys, showing how prospects move through different stages until conversion.
Usage: It helps identify friction points where prospects might drop off, allowing you to optimize each stage to improve conversion rates.
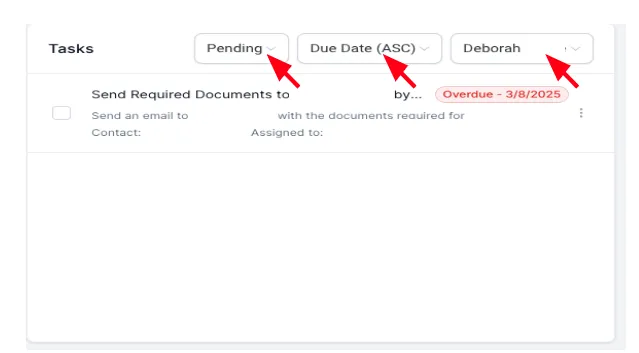
Tasks
Description: This widget centralizes all assigned tasks, providing an overview of actions to be taken.
Usage: It helps efficiently manage daily activities, track responsibilities, and ensure deadlines are met.
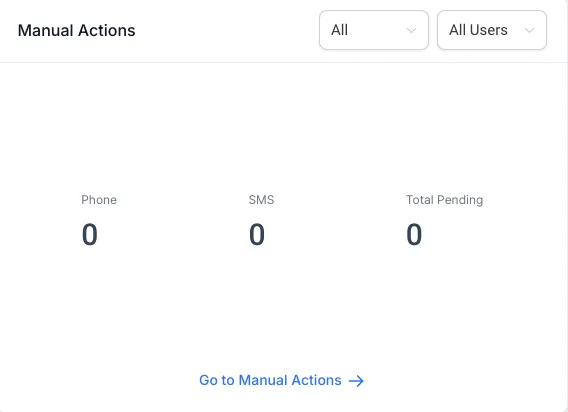
Manual Actions
Description: This widget lists actions that require human intervention, such as phone calls or sending personalized messages.
Usage: It ensures these critical actions are not overlooked and are executed promptly to maintain engagement with prospects or clients.
Google Analytics Report
Description: This widget integrates Google Analytics data directly into the dashboard, providing insights into website traffic, user behavior, and other key metrics.
Usage: It allows you to monitor website performance without leaving Tchoum Growth, making quick analysis and informed decision-making easier.

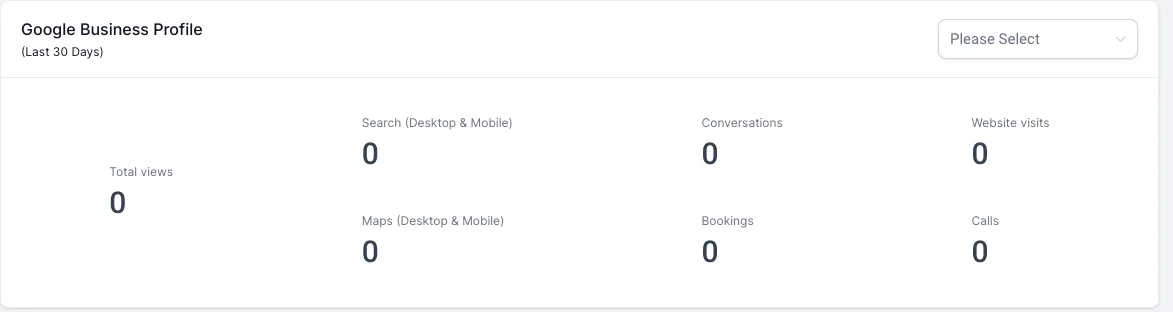
Google Business Profile
Description: This widget displays information and performance related to your Google Business Profile, including reviews, interactions, and visibility statistics.
Usage: It helps manage online reputation, respond to reviews, and understand how potential customers interact with your business on Google.
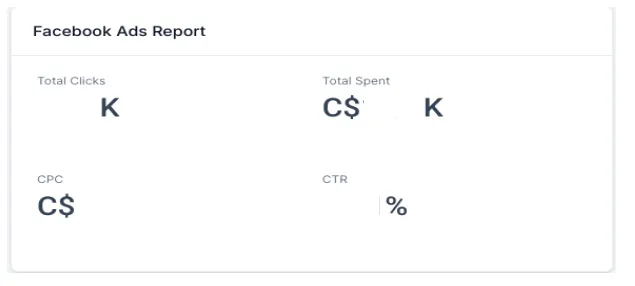
Facebook Ads Report
Description: This widget presents the performance of your Facebook ad campaigns, including metrics such as impressions, clicks, cost per click (CPC), and click-through rate (CTR).
Usage: It provides an overview of the effectiveness of your Facebook ads, allowing you to adjust campaigns for better return on investment.
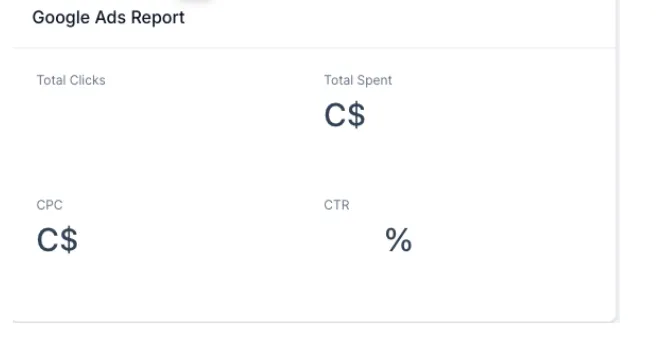
Google Ads Report
Description: This widget provides data on the performance of your Google Ads campaigns, such as impressions, clicks, CPC, and CTR.
Usage: It allows you to monitor and optimize your Google ad campaigns to maximize their effectiveness.
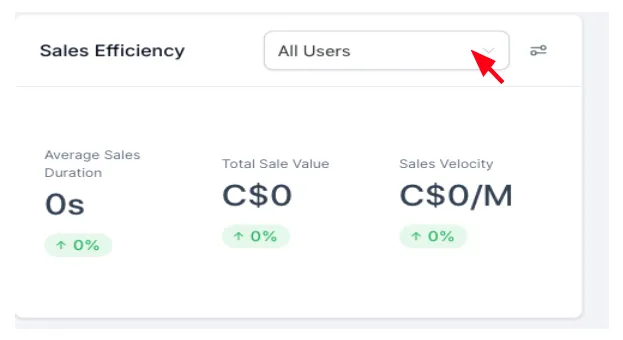
Sales Effectiveness
Description: This widget measures the effectiveness of your sales team by analyzing metrics such as the number of leads converted, average conversion time, and revenue generated per representative.
Usage: It identifies areas for improvement in the sales process and helps implement strategies to boost overall performance.
④ Dashboard Customization
Add a New Dashboard:
• Navigate to the Dashboards Menu.
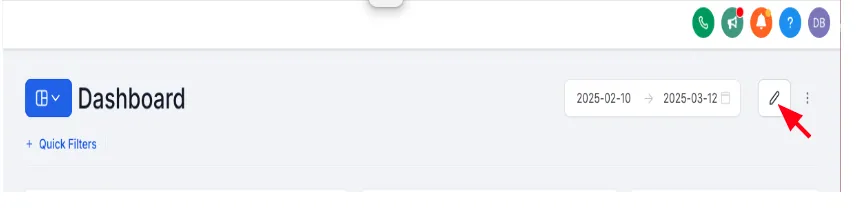
• Click on "Add Dashboard.
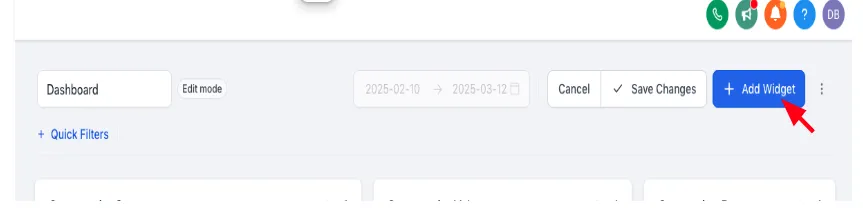
• Assign a clear and descriptive title.
• Configure the permissions according to your preferences (private or shared with the team).
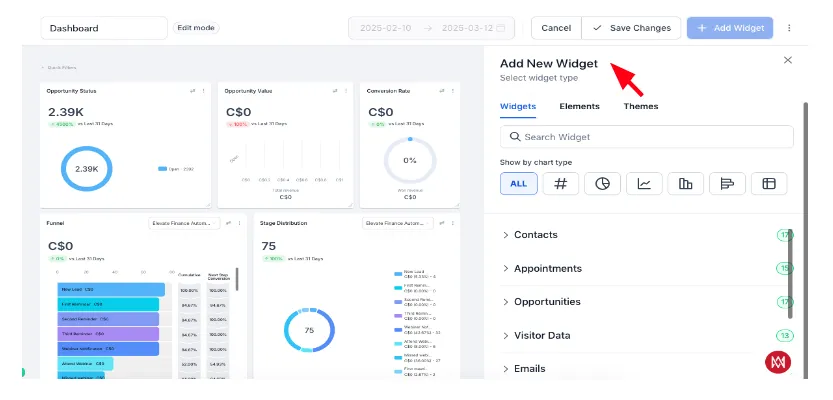
• Click on "Confirm."
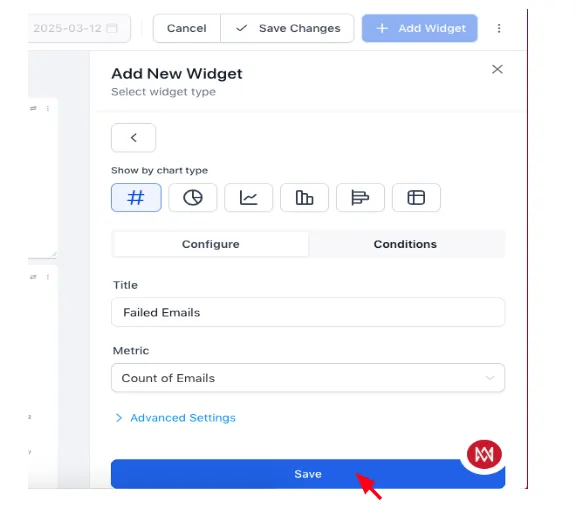
• Add relevant widgets to your new Dashboard.
Edit an Existing Dashboard:
• Access the Dashboard you want to edit.
• Use the "Edit" option to adjust the widgets, their layout, and their settings.
Customize the Widgets:
• Add or remove widgets according to your needs.
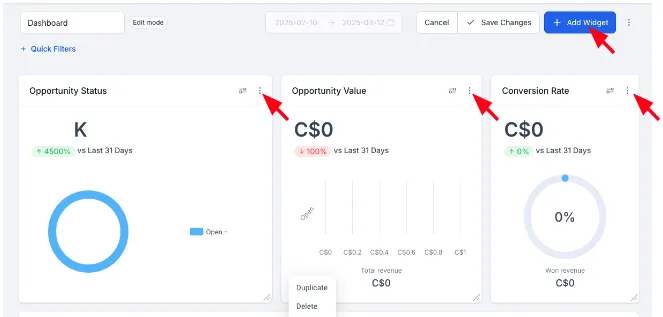
• Reorganize the widgets by drag-and-drop to prioritize important information.
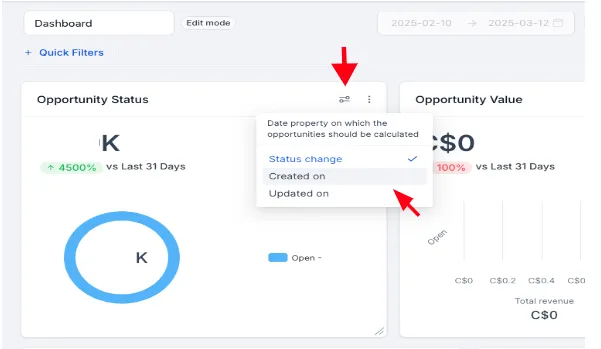
• Adjust each widget's individual settings to display the most relevant data.
⑤ Dashboard Permissions Management
Configure Permissions:
When creating or editing a Dashboard, set the permissions to control who can view or modify it. Options include setting the Dashboard as private or sharing it with specific team members.
⑥ Creating Dashboard Templates
Why Use Templates?
Dashboard templates allow you to easily replicate dashboards across different sub-accounts, ensuring consistency and saving time.
How to Create a Template ?
• Switch to "Agency View" mode in Tchoum Growth.
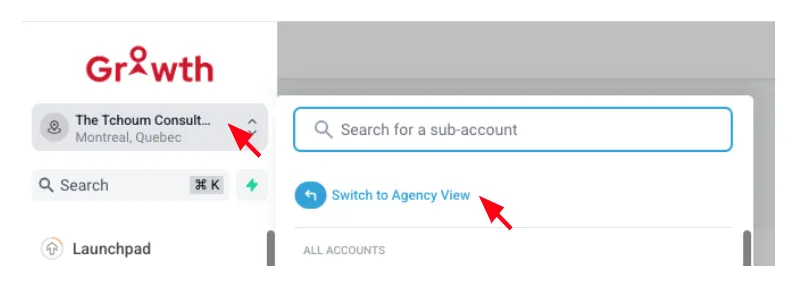
• Navigate to the "Template Library".
• Click on "Create a Template".
• Select the source sub-account containing the Dashboard to replicate.
• Choose "Dashboards" as the product type.
• Select the specific Dashboard to use as a template.